Why fatigue is so important when using Finite Element Analysis?

Why do we need fatigue analysis when doing Finite Element Analysis?
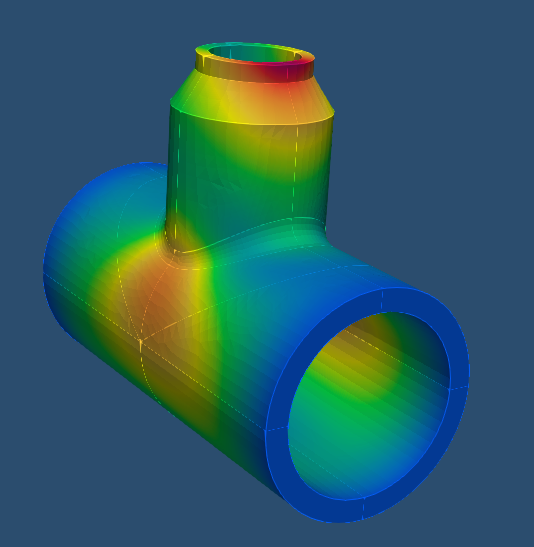
Fatigue is a relevant issue when using Finite Element Analysis (FEA) because we need to have an Accurate Prediction of Fatigue Life. FEA allows engineers to simulate the complex stress distributions experienced by components under cyclic loading conditions. By accurately predicting stress and strain levels throughout the structure, FEA provides valuable insights into the factors contributing to fatigue damage accumulation. This enables engineers to estimate the fatigue life of components and assess their durability over time, ensuring that designs meet desired performance and reliability requirements.
Likewise, the Identification of Critical Areas for fatigue analysis is of vital importance. FEA helps identify critical areas within a structure where fatigue failure is likely to occur. By analyzing stress concentrations, fatigue-prone regions, and potential crack initiation sites, engineers can focus their fatigue analysis efforts on these areas. This targeted approach allows for more efficient use of resources and facilitates the implementation of design modifications or structural reinforcements to improve fatigue resistance and prevent premature failure.
What is fatigue analysis?
Fatigue analysis is a process used in engineering and materials science to predict the behavior of a material or structure under repeated or cyclic loading. It involves assessing how a material or structure will degrade over time due to the application of cyclic stresses, leading to the eventual failure of the component. This analysis is crucial in industries such as aerospace, automotive, and civil engineering, where components are subjected to varying loads over their operational lifetimes. By understanding the fatigue behavior of materials and structures, engineers can design more durable and reliable products, ensuring safety and longevity in various applications.
Types of fatigue
Fatigue can be categorized into several types, each with its own specific mechanisms and characteristics:
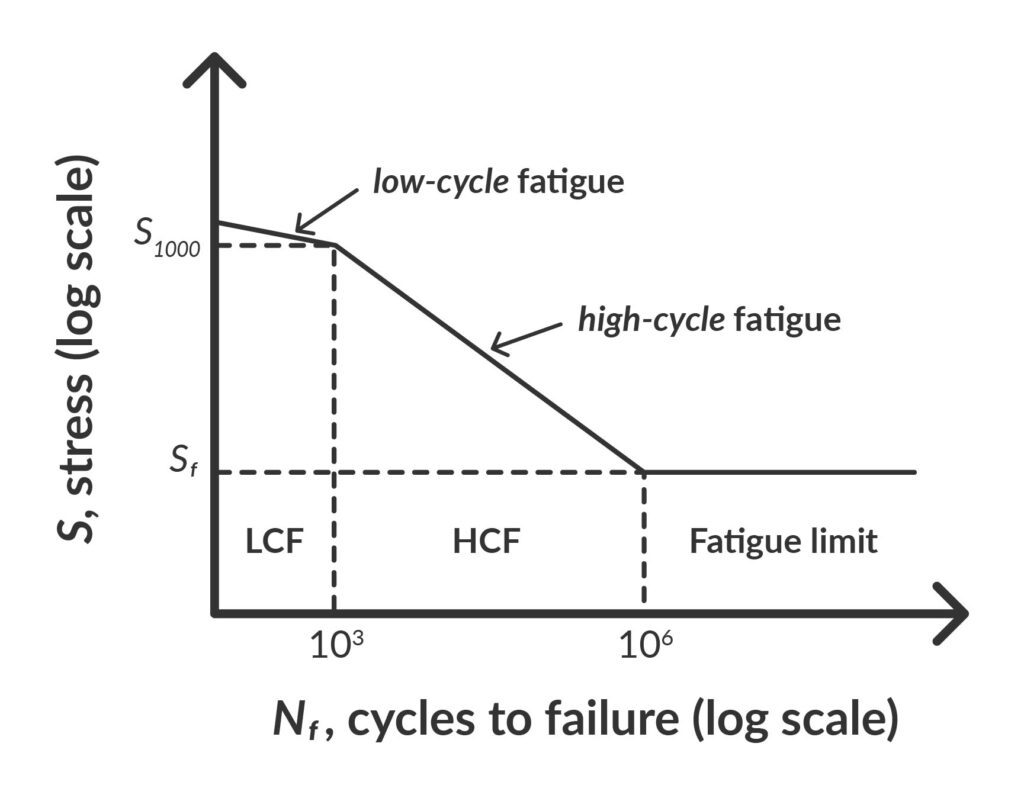
- Low Cycle Fatigue (LCF): LCF occurs at high stresses and involves a relatively small number of cycles to failure. It is typically associated with plastic deformation and is common in applications involving large loads or high temperatures.
- High Cycle Fatigue (HCF): HCF occurs at lower stresses and involves a large number of cycles to failure. It is often associated with elastic deformation and is prevalent in applications such as rotating machinery, where components experience high-frequency loading.
- Thermal Fatigue: Thermal fatigue results from cyclic temperature variations, leading to thermal expansion and contraction of materials. It is commonly observed in components subjected to rapid temperature changes, such as engine parts or electronic devices.
- Corrosion Fatigue: Corrosion fatigue occurs in the presence of a corrosive environment, where cyclic loading exacerbates the degradation of materials due to corrosion. It is a significant concern in marine and aerospace applications, where components are exposed to harsh environmental conditions.
- Environmental Fatigue: Environmental fatigue encompasses fatigue mechanisms influenced by environmental factors such as temperature, humidity, and chemical exposure. It can interact with other types of fatigue, exacerbating material degradation and leading to premature failure.
- Fretting Fatigue: Fretting fatigue occurs at the interface between contacting surfaces subjected to small oscillatory movements under load. It is common in bolted or press-fitted joints and can lead to localized damage and eventual failure.
Understanding the specific type of fatigue relevant to a particular application is crucial for developing effective mitigation strategies and ensuring the reliability and durability of components and structures.

Low-cycle (LCF) and high-cycle fatigue (HCF) regions shown in a schematic S-N curve (taken from https://2021.help.altair.com/)
What is the Constant Life Diagram (CLD) in fatigue analysis?
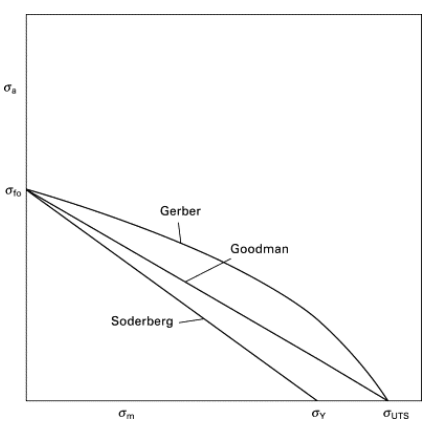
Constant Life Diagrams, also known as Goodman Diagrams or Smith Diagrams, are graphical representations used in fatigue analysis to illustrate the relationship between alternating stress (σa) and mean stress (σm) for a given number of cycles to failure (N). These diagrams are particularly useful for predicting the fatigue life of materials subjected to cyclic loading conditions, such as those encountered in structural components under repeated loading.

Schematic representation of the Constant Life Diagrams to relate mean stress amplitudes to fatigue life (taken from 'Determination of mechanical properties, J.W. Martin, in Materials for Engineering (Third Edition), 2006. Woodhead Publishing').
The Constant Life Diagram plots alternating stress (S) on the vertical axis and mean stress (Sm) on the horizontal axis. The stress values are typically normalized to the material's endurance limit or fatigue strength coefficient to allow for comparison across different materials and loading conditions.
The diagram includes curves or lines representing constant values of the fatigue life (N) for the material. Each curve corresponds to a specific number of cycles to failure, with shorter life represented by curves closer to the origin and longer life represented by curves farther from the origin.
The key features of Constant Life Diagrams include:
- Endurance Limit Line: This is a horizontal line representing the material's endurance limit, which indicates the maximum alternating stress the material can withstand indefinitely without fatigue failure, regardless of the mean stress level.
- Goodman Line: This is a diagonal line connecting the points where the alternating stress and mean stress axes intersect the endurance limit line. The Goodman line represents a linear relationship between alternating stress and mean stress for a given number of cycles to failure.
- Constant Life Curves: These are curves or lines representing constant values of fatigue life (N) for the material. Each curve corresponds to a specific number of cycles to failure, with shorter life represented by curves closer to the origin and longer life represented by curves farther from the origin.
Then, Constant Life Diagrams are valuable tools in fatigue analysis for assessing the effects of varying stress levels on the fatigue life of materials. Engineers can use these diagrams to determine the allowable stress range for a given number of cycles to failure, aiding in the design and optimization of components to meet desired durability requirements.
Fatigue analysis with Finite Element Analysis
Fatigue analysis using finite element analysis (FEA) is a computational technique employed in engineering to evaluate the durability and structural integrity of components subjected to cyclic loading. FEA divides complex structures into discrete elements, allowing engineers to simulate the effects of cyclic stresses on each element and their interactions. By inputting material properties, loading conditions, and geometric details, FEA predicts stress distribution, strain accumulation, and potential failure locations over time. This analysis aids in identifying critical areas prone to fatigue damage, such as stress concentrations or crack initiation sites. Engineers can then optimize designs to mitigate fatigue risks, enhancing the reliability and longevity of components in various applications, including automotive, aerospace, and civil engineering. In short, fatigue analysis using FEA provides valuable insights into the fatigue behavior of structures, enabling informed design decisions and ensuring safety and performance throughout the operational lifespan.
